Configuring Latency on the Topology Network View
Click a connection on the Topology map to show the average latency for the attachments that are part of this connection.
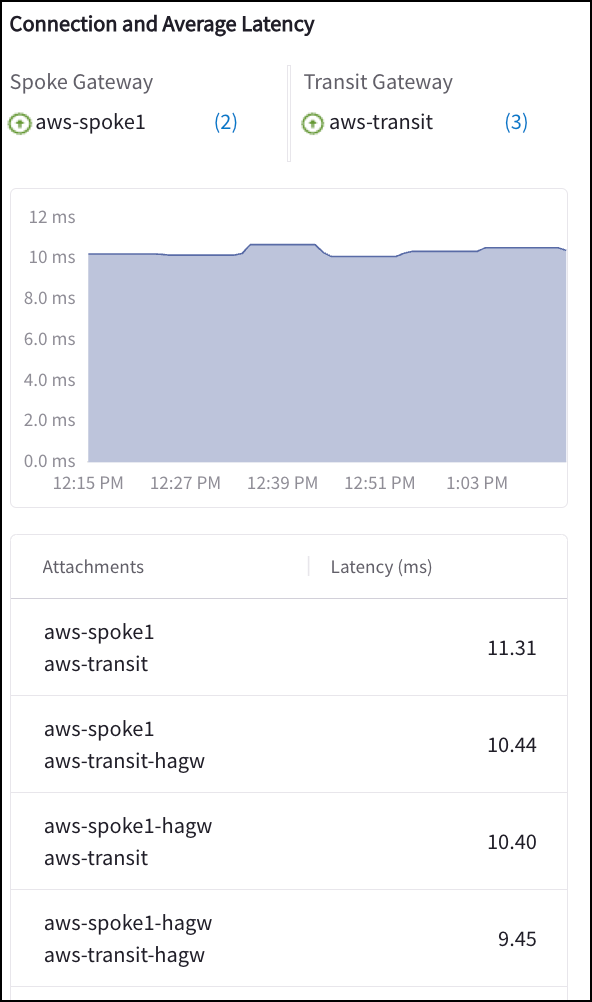
| If the connection between gateways is a solid or dotted red line, you may see a message in the right pane that no data can be found. |
Average Latency Display
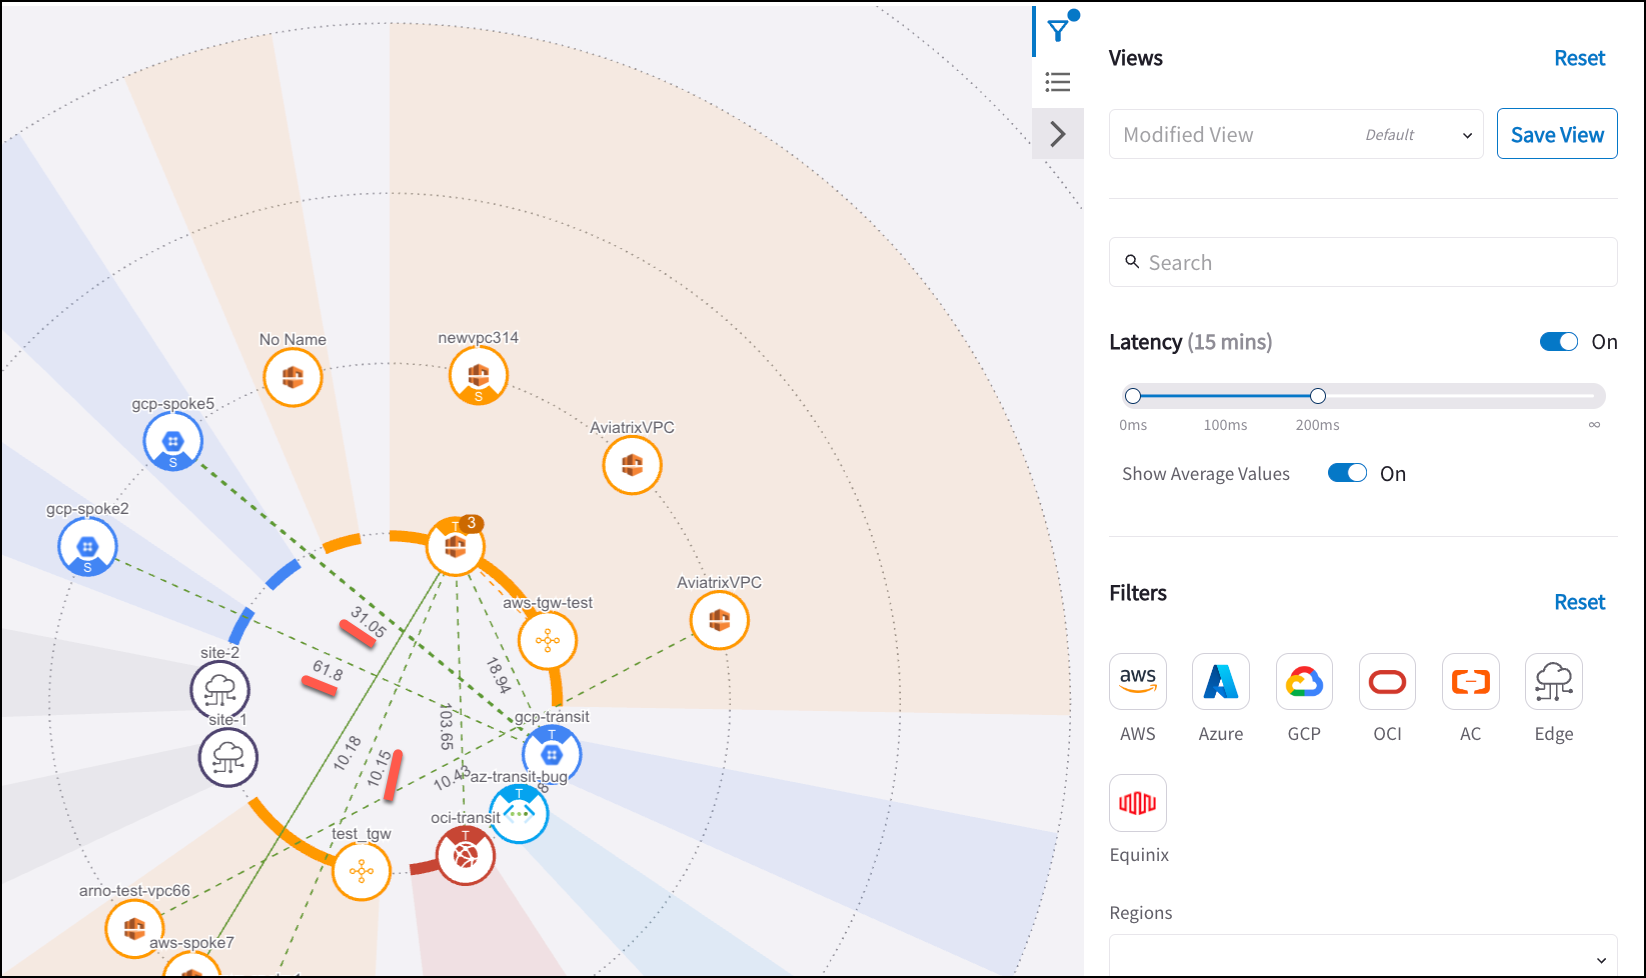
If you enable Latency as part of a Topology map filter, you can also show the average values for connections on the Topology map, as shown below.
Latencies tab
After viewing the Connection and Average Latency information for a connection, you can click Latencies Details on the Topology map right-hand pane to view the Latencies tab. The Gateways field on this tab is populated with the Spoke and Transit Gateways from the Connection and Average Latency pane.
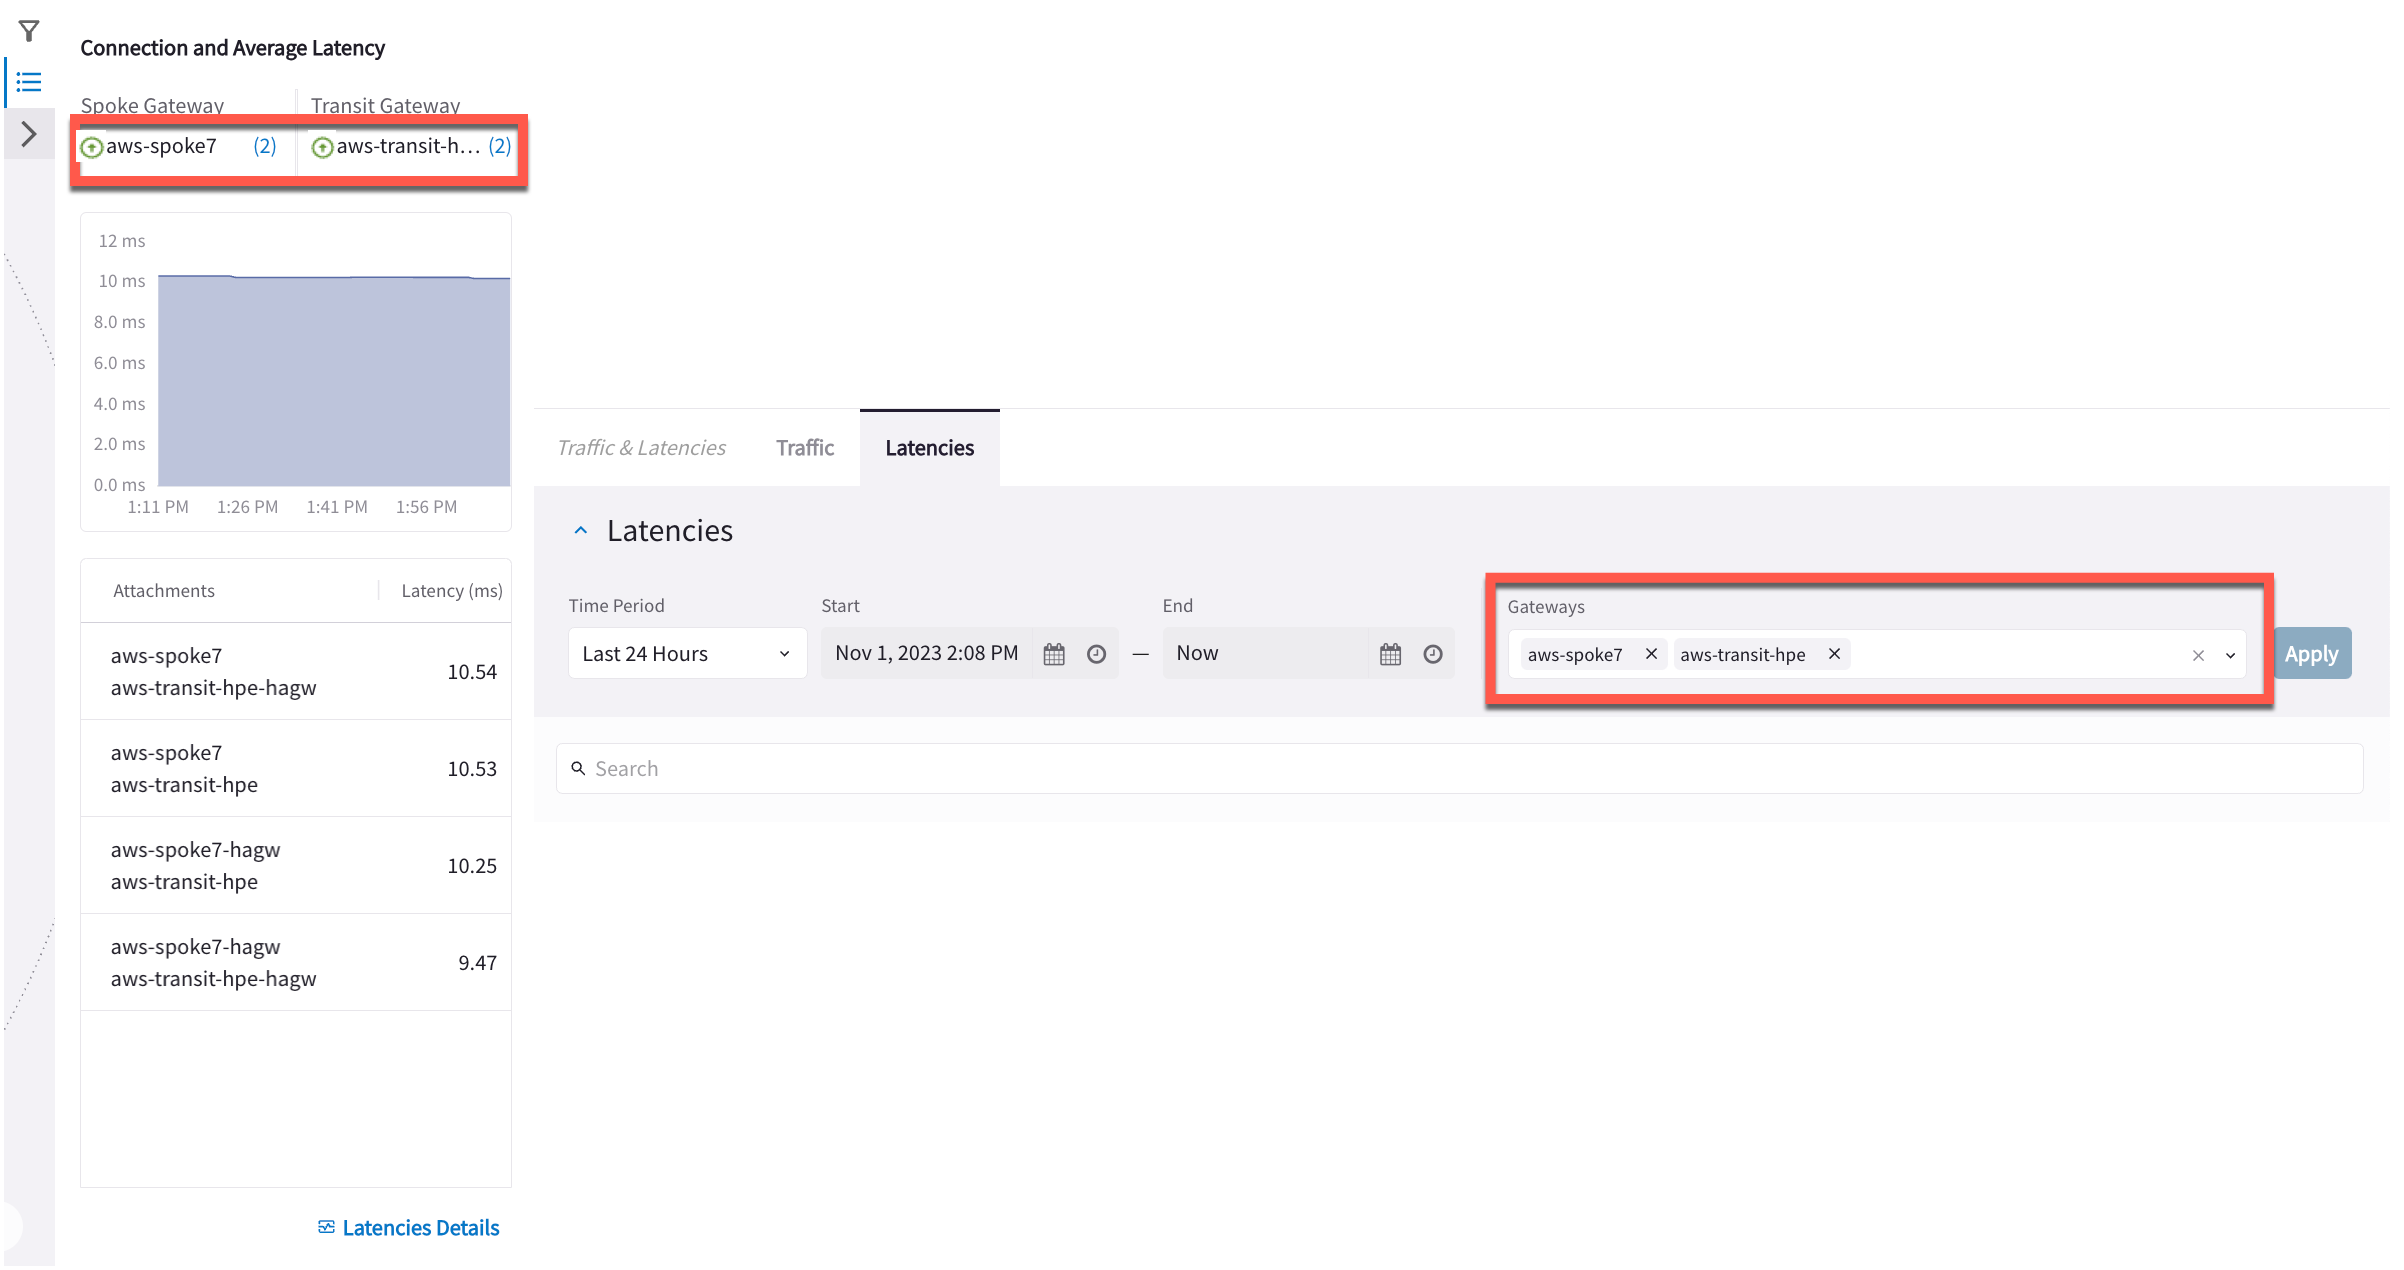
You can filter based on time period (last 15, 30, 60 minutes; last 24 hours, last seven days, or show a Live View).